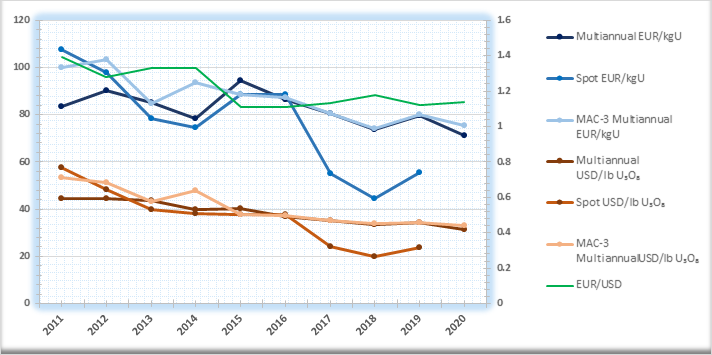
ESA indices 2011-2020
ESA indices 1980-2020
			Year | 
			
			MultiannualEUR/kgU | 
			
			MultiannualUSD/lb U₃O₈ | 
			
			SpotEUR/kgU | 
			
			SpotUSD/lb U₃O₈ | 
			
			MAC-3EUR/kg U | 
			
			MAC-3USD/lb U₃O₈ | 
			
			Exchange rateEUR/USD | 
		
|---|---|---|---|---|---|---|---|
| 
			 2020  | 
			
			 71.37  | 
			
			 31.36  | 
			
			 (***)  | 
			
			 (***)  | 
			
			 75.51  | 
			
			 33.17  | 
			
			 1.14  | 
		
| 
			 2019  | 
			
			 79.43  | 
			
			 34.2  | 
			
			 55.61  | 
			
			 23.94  | 
			
			 80  | 
			
			 34.45  | 
			
			 1.12  | 
		
| 
			 2018  | 
			
			 73.74  | 
			
			 33.5  | 
			
			 44.34  | 
			
			 20.14  | 
			
			 74.19  | 
			
			 33.7  | 
			
			 1.18  | 
		
| 
			 2017  | 
			
			 80.55  | 
			
			 35  | 
			
			 55.16  | 
			
			 23.97  | 
			
			 80.5  | 
			
			 34.98  | 
			
			 1.13  | 
		
| 
			 2016  | 
			
			 86.62  | 
			
			 36.88  | 
			
			 88.56  | 
			
			 37.71  | 
			
			 87.11  | 
			
			 37.09  | 
			
			 1.11  | 
		
| 
			 2015  | 
			
			 94.3  | 
			
			 40.24  | 
			
			 88.73  | 
			
			 37.87  | 
			
			 88.53  | 
			
			 37.78  | 
			
			 1.11  | 
		
| 
			 2014  | 
			
			 78.31  | 
			
			 40.02  | 
			
			 74.65  | 
			
			 38.15  | 
			
			 93.68  | 
			
			 47.87  | 
			
			 1.33  | 
		
| 
			 2013  | 
			
			 85.19  | 
			
			 43.52  | 
			
			 78.24  | 
			
			 39.97  | 
			
			 84.66  | 
			
			 43.25  | 
			
			 1.33  | 
		
| 
			 2012  | 
			
			 90.03  | 
			
			 44.49  | 
			
			 97.8  | 
			
			 48.33  | 
			
			 103.42  | 
			
			 51.11  | 
			
			 1.28  | 
		
| 
			 2011  | 
			
			 83.45  | 
			
			 44.68  | 
			
			 107.43  | 
			
			 57.52  | 
			
			 100.02  | 
			
			 53.55  | 
			
			 1.39  | 
		
| 
			 2010  | 
			
			 61.68  | 
			
			 31.45  | 
			
			 79.48  | 
			
			 40.53  | 
			
			 78.11  | 
			
			 39.83  | 
			
			 1.33  | 
		
| 
			 2009  | 
			
			 55.7  | 
			
			 29.88  | 
			
			 77.96  | 
			
			 41.83  | 
			
			 63.49(**)  | 
			
			 34.06(**)  | 
			
			 1.39  | 
		
| 
			 2008  | 
			
			 47.23  | 
			
			 26.72  | 
			
			 118.19  | 
			
			 66.86  | 
			
			 
  | 
			
			 
  | 
			
			 1.47  | 
		
| 
			 2007  | 
			
			 40.98  | 
			
			 21.6  | 
			
			 121.8  | 
			
			 64.21  | 
			
			 
  | 
			
			 
  | 
			
			 1.37  | 
		
| 
			 2006  | 
			
			 38.41  | 
			
			 18.38  | 
			
			 53.73  | 
			
			 25.95  | 
			
			 
  | 
			
			 
  | 
			
			 1.26  | 
		
| 
			 2005  | 
			
			 33.56  | 
			
			 16.06  | 
			
			 44.27  | 
			
			 21.19  | 
			
			 
  | 
			
			 
  | 
			
			 1.24  | 
		
| 
			 2004  | 
			
			 29.2  | 
			
			 13.97  | 
			
			 26.14  | 
			
			 12.51  | 
			
			 
  | 
			
			 
  | 
			
			 1.24  | 
		
| 
			 2003  | 
			
			 30.5  | 
			
			 13.27  | 
			
			 21.75  | 
			
			 9.46  | 
			
			 
  | 
			
			 
  | 
			
			 1.13  | 
		
| 
			 2002  | 
			
			 34  | 
			
			 12.37  | 
			
			 25.5  | 
			
			 9.27  | 
			
			 
  | 
			
			 
  | 
			
			 0.95  | 
		
| 
			 2001  | 
			
			 38.25  | 
			
			 13.18  | 
			
			 21(*)  | 
			
			 7.23(*)  | 
			
			 
  | 
			
			 
  | 
			
			 0.9  | 
		
| 
			 2000  | 
			
			 37  | 
			
			 13.12  | 
			
			 22.75  | 
			
			 8.07  | 
			
			 
  | 
			
			 
  | 
			
			 0.92  | 
		
| 
			 1999  | 
			
			 34.75  | 
			
			 14.25  | 
			
			 24.75  | 
			
			 10.15  | 
			
			 
  | 
			
			 
  | 
			
			 1.07  | 
		
| 
			 1998  | 
			
			 34  | 
			
			 14.66  | 
			
			 25  | 
			
			 10.78  | 
			
			 
  | 
			
			 
  | 
			
			 1.12  | 
		
| 
			 1997  | 
			
			 34.75  | 
			
			 15.16  | 
			
			 30  | 
			
			 13.09  | 
			
			 
  | 
			
			 
  | 
			
			 1.13  | 
		
| 
			 1996  | 
			
			 32  | 
			
			 15.63  | 
			
			 17.75  | 
			
			 8.67  | 
			
			 
  | 
			
			 
  | 
			
			 1.27  | 
		
| 
			 1995  | 
			
			 34.75  | 
			
			 17.48  | 
			
			 15.25  | 
			
			 7.67  | 
			
			 
  | 
			
			 
  | 
			
			 1.31  | 
		
| 
			 1994  | 
			
			 44.25  | 
			
			 20.25  | 
			
			 18.75  | 
			
			 8.58  | 
			
			 
  | 
			
			 
  | 
			
			 1.19  | 
		
| 
			 1993  | 
			
			 47  | 
			
			 21.17  | 
			
			 20.5  | 
			
			 9.23  | 
			
			 
  | 
			
			 
  | 
			
			 1.17  | 
		
| 
			 1992  | 
			
			 49.5  | 
			
			 24.71  | 
			
			 19.25  | 
			
			 9.61  | 
			
			 
  | 
			
			 
  | 
			
			 1.3  | 
		
| 
			 1991  | 
			
			 54.75  | 
			
			 26.09  | 
			
			 19  | 
			
			 9.05  | 
			
			 
  | 
			
			 
  | 
			
			 1.24  | 
		
| 
			 1990  | 
			
			 60  | 
			
			 29.39  | 
			
			 19.75  | 
			
			 9.68  | 
			
			 
  | 
			
			 
  | 
			
			 1.27  | 
		
| 
			 1989  | 
			
			 69.25  | 
			
			 29.35  | 
			
			 28.75  | 
			
			 12.19  | 
			
			 
  | 
			
			 
  | 
			
			 1.1  | 
		
| 
			 1988  | 
			
			 70  | 
			
			 31.82  | 
			
			 35.5  | 
			
			 16.13  | 
			
			 
  | 
			
			 
  | 
			
			 1.18  | 
		
| 
			 1987  | 
			
			 73.5  | 
			
			 32.5  | 
			
			 39  | 
			
			 17.25  | 
			
			 
  | 
			
			 
  | 
			
			 1.15  | 
		
| 
			 1986  | 
			
			 81.89  | 
			
			 31  | 
			
			 46.89  | 
			
			 17.75  | 
			
			 
  | 
			
			 
  | 
			
			 0.98  | 
		
| 
			 1985  | 
			
			 99.77  | 
			
			 29  | 
			
			 51.09  | 
			
			 15  | 
			
			 
  | 
			
			 
  | 
			
			 0.76  | 
		
| 
			 1984  | 
			
			 98  | 
			
			 29.75  | 
			
			 63.41  | 
			
			 19.25  | 
			
			 
  | 
			
			 
  | 
			
			 0.79  | 
		
| 
			 1983  | 
			
			 90.51  | 
			
			 31  | 
			
			 67.89  | 
			
			 23.25  | 
			
			 
  | 
			
			 
  | 
			
			 0.89  | 
		
| 
			 1982  | 
			
			 84.86  | 
			
			 32  | 
			
			 63.65  | 
			
			 24  | 
			
			 
  | 
			
			 
  | 
			
			 0.98  | 
		
| 
			 1981  | 
			
			 77.45  | 
			
			 33.25  | 
			
			 65.22  | 
			
			 28  | 
			
			 
  | 
			
			 
  | 
			
			 1.12  | 
		
| 
			 1980  | 
			
			 67.2  | 
			
			 36  | 
			
			 65.34  | 
			
			 35  | 
			
			 
  | 
			
			 
  | 
			
			 1.39  | 
		
(*)   The spot price for 2001 was calculated on the basis of an exceptionally low total volume of only some 330 tU under four transactions.
(**)  ESA’s price method took account of the ESA ‘MAC-3’ new multiannual U₃O₈ price, which includes amended contracts from 2009 onwards.
(***) In 2020, the ESA U3O8 spot price was not calculated because there were not enough transactions (less than 3) to calculate the index.
Disclaimer: This information is made available for information purposes only, and ESA can take no legal responsibility for the use made of it. ESA ensures confidentiality and physical protection of the commercial data.
